#
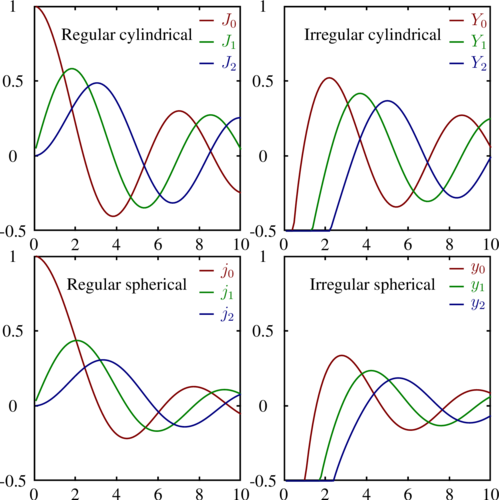
# Figure with multiple plots, each with a different type of Bessel function
#
default {
layout 4
width 350
height 350
plot {
curve1 {
color red
line solid
symbol {shape none}
}
curve2 {
color green
line solid
symbol {shape none}
}
curve3 {
color blue
line solid
symbol {shape none}
}
key 8, 0.95
xaxis {
min 0
max 10
ticks {
number 6
length 3
}
}
yaxis {
min -0.5
max 1
ticks {
number 4
length 3
}
}
}
}
plot {
curve {
read 'bessel.dat', ycol=2, delim=|
title '$J_0$'
}
curve {
read 'bessel.dat', ycol=6, delim=|
title '$J_1$'
}
curve {
read 'bessel.dat', ycol=10, delim=|
title '$J_2$'
}
label 'Regular cylindrical', 4.5, 0.8
}
plot {
curve {
read 'bessel.dat', ycol=3, delim=|
title '$Y_0$'
}
curve {
read 'bessel.dat', ycol=7, delim=|
title '$Y_1$'
}
curve {
read 'bessel.dat', ycol=11, delim=|
title '$Y_2$'
}
label 'Irregular cylindrical', 4.3, 0.8
}
plot {
curve {
read 'bessel.dat', ycol=4, delim=|
title '$j_0$'
}
curve {
read 'bessel.dat', ycol=8, delim=|
title '$j_1$'
}
curve {
read 'bessel.dat', ycol=12, delim=|
title '$j_2$'
}
label 'Regular spherical', 4.5, 0.8
}
plot {
curve {
read 'bessel.dat', ycol=5, delim=|
title '$y_0$'
}
curve {
read 'bessel.dat', ycol=9, delim=|
title '$y_1$'
}
curve {
read 'bessel.dat', ycol=13, delim=|
title '$y_2$'
}
label 'Irregular spherical', 4.3, 0.8
}