#
# Lots of labels, some with rotation
#
plot {
key hide
xaxis {title '$x$'}
yaxis {
title '$y(x)$'
min 0
max 0.32
ticks {
max 0.3
number 4
}
}
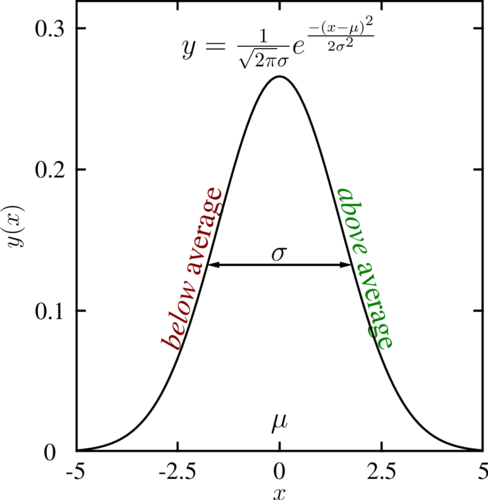
curve {
generate '1/(1.5*sqrt(2*PI))*exp(-x**2/(2*1.5**2))', -5, 5, 0.1
line solid, black
symbol none
}
label '{\large $y = \frac{1}{\sqrt{2\pi}\sigma}e^{\frac{-(x-\mu)^2}{2\sigma^2}}$}', 0, 0.29
label '{\large $\mu$}', 0, 0.02
label '{\large $\sigma$}', 0, 0.14
label '{\large \textit{below} average}', -2.1, 0.13, angle=75, color=red
label '{\large \textit{above} average}', 2.1, 0.13, angle=-75, color=green
arrow {
from 0, 0.1325
to 1.78, 0.1325
}
arrow {
from 0, 0.1325
to -1.78, 0.1325
}
}