{
"plots": ["plot1"],
"plot1": {
"key": {"show": false},
"xaxis": {"title": {"text": "$x$"}},
"yaxis": {
"min": "0", "max": "0.32",
"title": {"text": "$y(x)$"},
"ticks": {"max": "0.3", "number": "4"}
},
"curves": ["curve1"],
"curve1": {
"data": {
"x": [-5.0, -4.9, -4.8, -4.7, -4.6, -4.5, -4.4, -4.3, -4.2, -4.1, -4.0, -3.9, -3.8, -3.7, -3.6, -3.5, -3.4, -3.3, -3.2, -3.1, -3.0, -2.9, -2.8, -2.7, -2.6, -2.5, -2.4, -2.3, -2.2, -2.1, -2.0, -1.9, -1.8, -1.7, -1.6, -1.5, -1.4, -1.3, -1.2, -1.1, -1.0, -0.9, -0.8, -0.7, -0.6, -0.5, -0.4, -0.3, -0.2, -0.1, -0.0, 0.1, 0.2, 0.3, 0.4, 0.5, 0.6, 0.7, 0.8, 0.9, 1.0, 1.1, 1.2, 1.3, 1.4, 1.5, 1.6, 1.7, 1.8, 1.9, 2.0, 2.1, 2.2, 2.3, 2.4, 2.5, 2.6, 2.7, 2.8, 2.9, 3.0, 3.1, 3.2, 3.3, 3.4, 3.5, 3.6, 3.7, 3.8, 3.9, 4.0, 4.1, 4.2, 4.3, 4.4, 4.5, 4.6, 4.7, 4.8, 4.9, 5.0],
"y": [0.001028185998, 0.001281198646, 0.001589392134, 0.001962978080, 0.002413624152, 0.002954565608, 0.003600704121, 0.004368688059, 0.005276967722, 0.006345818437, 0.007597324016, 0.009055312822, 0.010745238742, 0.012693999677, 0.014929686863, 0.017481259396, 0.020378139819, 0.023649728564, 0.027324837363, 0.031431044477, 0.035993977675, 0.041036534233, 0.046578050714, 0.052633438867, 0.059212307394, 0.066318092528, 0.073947223120, 0.082088348017, 0.090721654942, 0.099818310424, 0.109340049784, 0.119238944330, 0.129457369989, 0.139928197416, 0.150575218311, 0.161313816346, 0.172051883935, 0.182690978265, 0.193127701841, 0.203255284640, 0.212965337015, 0.222149735261, 0.230702595451, 0.238522286112, 0.245513426869, 0.251588818462, 0.256671249731, 0.260695129317, 0.263607893924, 0.265371150876, 0.265961520268, 0.265371150876, 0.263607893924, 0.260695129317, 0.256671249731, 0.251588818462, 0.245513426869, 0.238522286112, 0.230702595451, 0.222149735261, 0.212965337015, 0.203255284640, 0.193127701841, 0.182690978265, 0.172051883935, 0.161313816346, 0.150575218311, 0.139928197416, 0.129457369989, 0.119238944330, 0.109340049784, 0.099818310424, 0.090721654942, 0.082088348017, 0.073947223120, 0.066318092528, 0.059212307394, 0.052633438867, 0.046578050714, 0.041036534233, 0.035993977675, 0.031431044477, 0.027324837363, 0.023649728564, 0.020378139819, 0.017481259396, 0.014929686863, 0.012693999677, 0.010745238742, 0.009055312822, 0.007597324016, 0.006345818437, 0.005276967722, 0.004368688059, 0.003600704121, 0.002954565608, 0.002413624152, 0.001962978080, 0.001589392134, 0.001281198646, 0.001028185998]
},
"line": {"style": "solid", "color": "black"},
"symbol": {"shape": "none"}
},
"labels": ["label1", "label2", "label3", "label4", "label5"],
"label1": {
"title": {
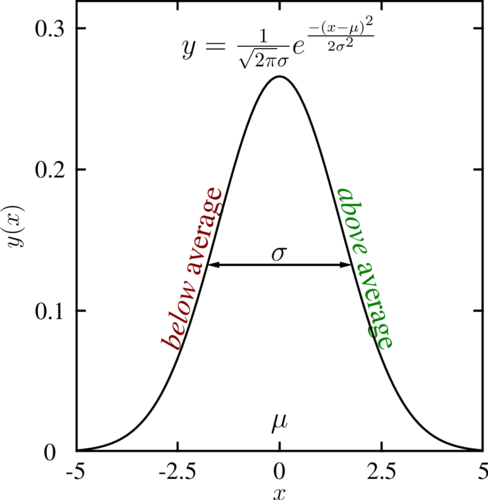
"text": "{\\large $y = \\frac{1}{\\sqrt{2\\pi}\\sigma}e^{\\frac{-(x-\\mu)^2}{2\\sigma^2}}$}"
},
"position": "0,0.29"
},
"label2": {
"title": {"text": "{\\large $\\mu$}"},
"position": "0,0.02"
},
"label3": {
"title": {"text": "{\\large $\\sigma$}"},
"position": "0,0.14"
},
"label4": {
"title": {"text": "{\\large \\textit{below} average}", "color": "red"},
"position": "-2.1,0.13",
"angle": "75"
},
"label5": {
"title": {"text": "{\\large \\textit{above} average}", "color": "green"},
"position": "2.1,0.13",
"angle": "-75"
},
"arrows": ["arrow1", "arrow2"],
"arrow1": {"from": "0,0.1325", "to": "1.78,0.1325"},
"arrow2": {"from": "0,0.1325", "to": "-1.78,0.1325"}
}
}