{
"font_family": "sffamily",
"rgb": {"litegray": "0.9 0.9 0.9"},
"plots": ["plot1"],
"plot1": {
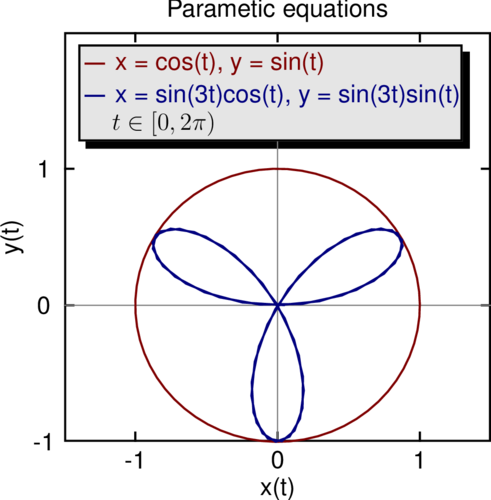
"title": {"text": "Parametic equations"},
"xaxis": {
"title": {"text": "x(t)"},
"min": "-1.5",
"max": "1.5",
"ticks": {
"min": "-1",
"max": "1",
"number": "3"
}
},
"yaxis": {
"title": {"text": "y(t)"},
"min": "-1",
"max": "2",
"ticks": {
"min": "-1",
"max": "1",
"number": "3"
}
},
"curves": ["curve1", "curve2"],
"curve1": {
"data": {
"x": [1.000000000, 0.995004165, 0.980066578, 0.955336489, 0.921060994, 0.877582562, 0.825335615, 0.764842187, 0.696706709, 0.621609968, 0.540302306, 0.453596121, 0.362357754, 0.267498829, 0.169967143, 0.070737202, -0.029199522, -0.128844494, -0.227202095, -0.323289567, -0.416146837, -0.504846105, -0.588501117, -0.666276021, -0.737393716, -0.801143616, -0.856888753, -0.904072142, -0.942222341, -0.970958165, -0.989992497, -0.999135150, -0.998294776, -0.987479770, -0.966798193, -0.936456687, -0.896758416, -0.848100032, -0.790967712, -0.725932304, -0.653643621, -0.574823947, -0.490260821, -0.400799172, -0.307332870, -0.210795799, -0.112152527, -0.012388663, 0.087498983, 0.186512369, 0.283662185, 0.377977743, 0.468516671, 0.554374336, 0.634692876, 0.708669774, 0.775565879, 0.834712785, 0.885519517, 0.927478431, 0.960170287, 0.983268438, 0.996542097, 0.999858636],
"y": [0.000000000, 0.099833417, 0.198669331, 0.295520207, 0.389418342, 0.479425539, 0.564642473, 0.644217687, 0.717356091, 0.783326910, 0.841470985, 0.891207360, 0.932039086, 0.963558185, 0.985449730, 0.997494987, 0.999573603, 0.991664810, 0.973847631, 0.946300088, 0.909297427, 0.863209367, 0.808496404, 0.745705212, 0.675463181, 0.598472144, 0.515501372, 0.427379880, 0.334988150, 0.239249329, 0.141120008, 0.041580662, -0.058374143, -0.157745694, -0.255541102, -0.350783228, -0.442520443, -0.529836141, -0.611857891, -0.687766159, -0.756802495, -0.818277111, -0.871575772, -0.916165937, -0.951602074, -0.977530118, -0.993691004, -0.999923258, -0.996164609, -0.982452613, -0.958924275, -0.925814682, -0.883454656, -0.832267442, -0.772764488, -0.705540326, -0.631266638, -0.550685543, -0.464602179, -0.373876665, -0.279415498, -0.182162504, -0.083089403, 0.016813900]
},
"line": {"style": "solid", "color": "red"},
"symbol": {"shape": "none"},
"title": {"text": "x = cos(t), y = sin(t)", "color": "red"}
},
"curve2": {
"data": {
"x": [0.000000000, 0.294043837, 0.553387217, 0.748340780, 0.858464847, 0.875384206, 0.803751133, 0.660218940, 0.470599730, 0.265663594, 0.076247466, -0.071552835, -0.160350714, -0.183976642, -0.148139244, -0.069147745, 0.029087531, 0.119286125, 0.175573710, 0.178030891, 0.116277876, -0.008488432, -0.183342440, -0.385400545, -0.585245695, -0.751472693, -0.855640562, -0.876850359, -0.805222184, -0.643715387, -0.407994208, -0.124346789, 0.174029515, 0.451807439, 0.676637583, 0.823796977, 0.879662820, 0.843480082, 0.727159180, 0.553148499, 0.350727465, 0.151311937, -0.016484063, -0.131251484, -0.181963653, -0.169434381, -0.105837854, -0.012380108, 0.084494074, 0.157742245, 0.184462070, 0.149959106, 0.050484382, -0.105807099, -0.299842869, -0.504420758, -0.688366706, -0.821411641, -0.879019255, -0.846400538, -0.721075640, -0.513569551, -0.246119651, 0.050415560],
"y": [0.000000000, 0.029502792, 0.112177142, 0.231488930, 0.362953116, 0.478224571, 0.549875735, 0.556094742, 0.484547627, 0.334778161, 0.118748392, -0.140584124, -0.412446349, -0.662702712, -0.858894110, -0.975081392, -0.995739847, -0.918097841, -0.752554865, -0.521113777, -0.254071794, 0.014513916, 0.251880072, 0.431345547, 0.536093420, 0.561366857, 0.514750464, 0.414511391, 0.286280507, 0.158614944, 0.058158164, 0.005174897, 0.010176177, 0.072174317, 0.178846749, 0.308582518, 0.434084335, 0.526949905, 0.562498413, 0.524066523, 0.406079723, 0.215396550, -0.029305033, -0.300020926, -0.563418384, -0.785723485, -0.937741897, -0.999232699, -0.961954101, -0.830906184, -0.623576795, -0.367308248, -0.095195466, 0.158845383, 0.365070934, 0.502193262, 0.560291457, 0.541910371, 0.461191712, 0.341193283, 0.209837476, 0.095145041, 0.020520894, 0.000847802]
},
"line": {"style": "solid", "color": "blue"},
"symbol": {"shape": "none"},
"title": {
"text": "x = sin(3t)cos(t), y = sin(3t)sin(t)",
"color": "blue"
}
},
"arrows": ["arrow1", "arrow2"],
"arrow1": {
"from": "-1.5,0",
"to": "1.5,0",
"head": {"show": false},
"line": {"color": "gray", "width": "0.5"}
},
"arrow2": {
"from": "0,-1.5",
"to": "0,1.2",
"head": {"show": false},
"line": {"color": "gray", "width": "0.5"}
},
"labels": ["label1"],
"label1": {
"title": {"text": "$t \\in [0, 2\\pi)$"},
"position": "-0.8,1.33"
},
"boxes": ["box1"],
"box1": {
"ll": "-1.4,1.2",
"ur": "1.3,1.91",
"bgcolor": "litegray"
}
}
}