#
# Set defaults, custom tick range, boxes
#
default {
plot {
arrow {head 6, 2, 0}
box {
bgcolor boxgray
shadow {show false}
}
}
}
rgb boxgray, '0.75 0.75 0.75'
plot {
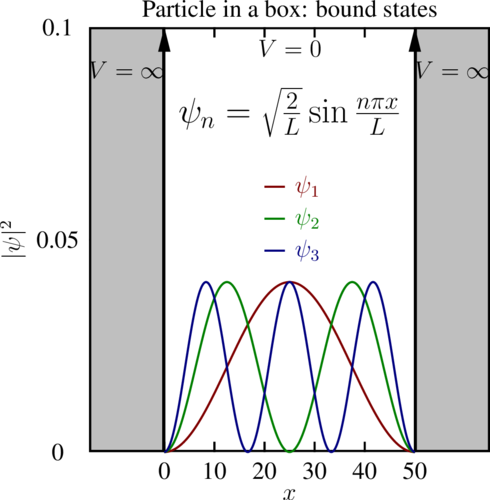
title 'Particle in a box: bound states'
key 20, 0.065
xaxis {
title '$x$'
min -15
max 65
ticks {
min 0
max 50
number 6
}
}
yaxis {
title '$|\psi|^2$'
min 0
max 0.1
ticks {number 3}
}
curve {
generate '(2.0/50.0)*sin(1.0*PI*x/50.0)**2', 0, 50, 0.1
line solid, red
symbol none
title '$\psi_1$', red
}
curve {
generate '(2.0/50.0)*sin(2.0*PI*x/50.0)**2', 0, 50, 0.1
line solid, green
symbol none
title '$\psi_2$', green
}
curve {
generate '(2.0/50.0)*sin(3.0*PI*x/50.0)**2', 0, 50, 0.1
line solid, blue
symbol none
title '$\psi_3$', blue
}
box {
ll -15, 0
ur 0, 0.1
}
box {
ll 50, 0
ur 65, 0.1
}
arrow {
from 0, 0
to 0, 0.1
}
arrow {
from 50, 0
to 50, 0.1
}
label '$V = 0$', 25, 0.095
label '$V = \infty$', -7.5, 0.09
label '$V = \infty$', 57.5, 0.09
label '{\Large $\psi_n = \sqrt{\frac{2}{L}}\sin\frac{n\pi x}{L}$}', 25, 0.08
}