#
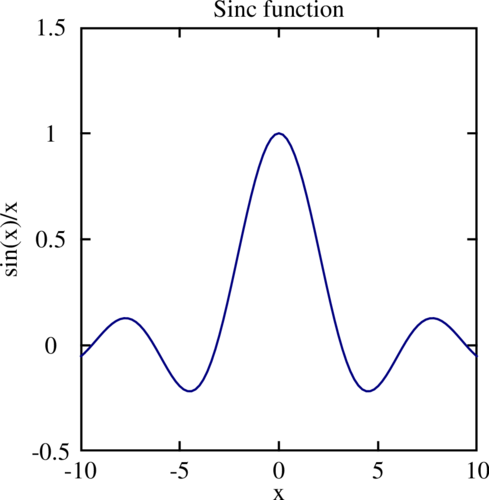
# Simple DSL example: plot the sinc function
#
plot {
title 'Sinc function'
key hide
xaxis {title 'x'}
yaxis {
title 'sin(x)/x'
min -0.5
max 1.5
}
curve {
generate 'sin(x)/x', -10, 10, 0.2
line solid, blue
symbol none
}
}